Using Scout
Starting a session
If you're running local Flash content, or you've followed the instructions in the previous section to configure your remote content to communicate with Scout, then you're ready to start profiling. Simply launch your content—this can be inside a browser, through the standalone version of Flash Player, or through Adobe AIR—and a new session will appear in Scout. You'll know it's working when you see a chart appearing with lots of vibrant colors!
Flash Player only checks whether Scout is there at the time it loads Flash content, so if your content was already running before you started Scout, you'll have to reload it. On the left side of the screen, you'll see a list of open sessions, including the name of the SWF and its domain. If you want to stop new data from coming in, click on the square, red stop button next to the session (see Figure 4). If you stop running your Flash content, the session will automatically stop recording data, and the stop button will be disabled.
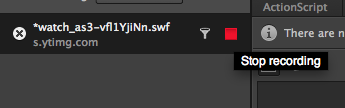
Figure 4. An active session in Scout, and its stop button
By default, all Flash content that you load will result in a new session in Scout. This makes it really easy to start profiling, but it can become annoying if you use the browser at the same time for other tasks; you'll see new sessions appearing whenever you load a page with any Flash content.
For more control, you can tell Scout to filter out unwanted sessions. If you click on the filter icon next to a session (see Figure 5), Scout will start new sessions only for SWFs that have the same name. This means that you can browse different websites without being swamped with sessions, but new sessions will still appear whenever you reload your content.
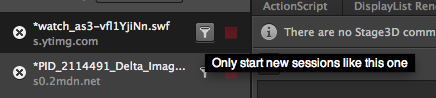
Figure 5. Filtering new sessions
Settings for new sessions
Now that you're able to start sessions in Scout, you can begin to think about the type of data you want to gather. You'll notice on the left of the screen, above the list of sessions, there's a section labeled Settings For New Sessions (see Figure 6). This presents you with various categories of data that you can ask Flash Player to send. Note that some features of Scout will only work if you enable collection of the relevant data.
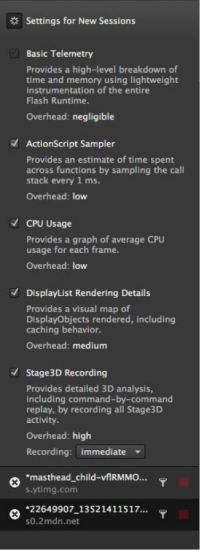
Figure 6. Settings for new sessions
Before you start a new session, check the boxes next to the data you want to collect. Because you can't change this setting in the middle of a session, it's important to think about what you're trying to measure beforehand. If you're interested in measuring performance, such as the time spent in a certain ActionScript function, only collect data that has low overhead. If you don't, the timing data may be inaccurate, because Flash Player has to do extra work to collect and send the data.
Here's a brief description of the categories:
- Basic Telemetry is always enabled, and gives you information about what Flash Player is doing internally, as well as a summary of CPU and GPU memory usage.
- ActionScript Sampler measures the time spent executing your ActionScript code by taking periodic snapshots of the call stack. This has low overhead because it uses statistical sampling. If you look at samples over a long enough period of time, it gives you an accurate picture of which functions take the longest.
- CPU Usage takes periodic measurements of the amount of CPU time Flash Player uses, as reported by the operating system. This corresponds to what you would see in Activity Monitor on Mac OS, or Task Manager on Windows.
- DisplayList Rendering Details gives you a detailed breakdown of all the objects on the DisplayList that are rendering, and visually maps them to the screen. This lets you see which regions of the screen take the most time to render.
- Stage3D Recording captures every Stage3D command that your content executes, so that you can replay and step through them in Scout. Since this can easily generate gigabytes of data in a matter of minutes, you have the option of setting the recording mode to delayed. This lets you control when Scout starts to capture Stage3D data.
Remember that to turn on any of the categories except Basic Telemetry, your content has to have advanced telemetry enabled.
Profiling
The Scout user interface is designed to be simple and efficient to use. There are lots of visual features that help you to understand the data and filter out unnecessary information, so that you can quickly find the cause of performance problems. The user interface has many different panels (see Figure 7), and it can look a bit overwhelming at first, but as you go through each part in detail you'll see how it all fits together.
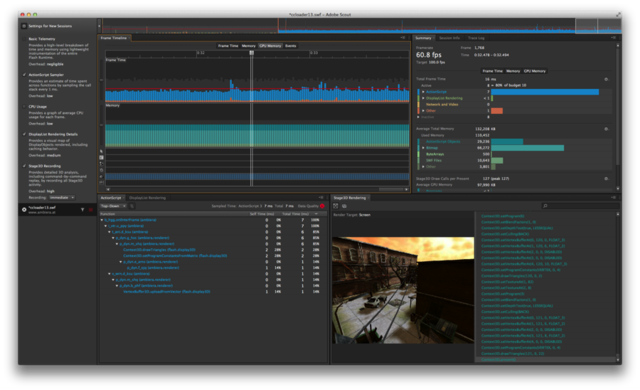
Figure 7. The Scout user interface
Panels can be repositioned; simply drag the tab, and move the panel where you want it. If you close a panel, you can always open it again from the Window menu. A specific layout of the panels is called a workspace. You can save and switch between different workspaces from the Window menu. You can hide the sidebar on the left, which shows the list of open sessions and the configuration options for new sessions, by clicking its collapse button (see Figure 8).
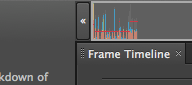
Figure 8. Collapsing the sidebar
The remainder of this section describes the panels in the order that you would normally step through while using Scout. The most important panel is the Frame Timeline, which is the one in the center with lots of charts. This shows you a breakdown of the time spent in each frame of your SWF, along with a few other charts for memory usage and events.
To make navigation within a session easy, the top of the screen shows a zoomed-out view of the Frame Timeline. This is called the Session Summary, since it lets you see at a glance where the spikes in activity are, across the whole session.
Session Summary
If you want to jump to a certain time or event in the session, for example, a big spike in activity, simply click on the part of the Session Summary you want to look at. By default, you see a chart showing the time spent in each frame, but you can also right-click on it (see Figure 9) to reveal some additional charts (see Figure 10).
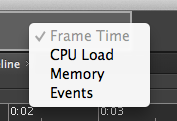
Figure 9. Session Summary options
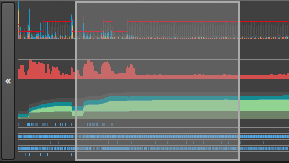
Figure 10. Session Summary showing Frame Time, CPU Load, Memory, and Events
These correspond to the charts that are available in the Frame Timeline, and you can select any of them to get an overall view of that chart across the whole session. This is particularly useful for monitoring memory usage over time. For example, a very slow memory leak can be clearly visible in the Session Summary if you've been running your content for long enough.
Frame Timeline
The main panel in Scout that you use for locating performance problems is the Frame Timeline. The chart at the top of this panel shows Frame Time, breaking down the session into individual frames, and showing you how much time Flash Player spent in each frame (see Figure 11).
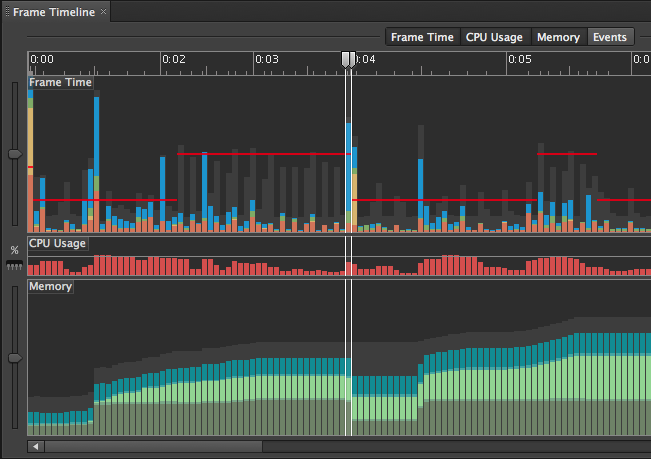
Figure 11. The Frame Timeline panel
The most important thing to notice is the red line. This represents the budget time that you have to keep below on each frame, if you're to meet the framerate you want to achieve. For example, on a SWF running at 30 frames per second (fps), you have a budget of 33ms per frame (1000ms / 30 frames). In other words, if you spend more than 33ms per frame, your application will start stuttering and skipping frames, which you really don't want to happen!
Figure 11 clearly shows which frames are over budget and require attention. You might be curious as to why the red budget line is varying; it's because you're allowed to change the framerate of your SWF dynamically, and that is happening in this particular content.
The next thing to notice in the Frame Time chart is the color variation in each bar. Each color represents a different activity that Flash Player performs, so that you can see what it spent the most time doing in every frame:
- Blue: Executing ActionScript
- Green: DisplayList Rendering
- Yellow: Network and Video
- Orange: Other (activities such as garbage collection, event processing, and so on)
Don't worry about remembering this color coding. The Summary panel, which you'll look at next, shows the meaning of each color. You can also hover over a particular part of the chart, and a tooltip will appear to tell you what it means (see Figure 12).
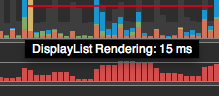
Figure 12. Tooltips in the Frame Timeline panel
There are a few other charts in the Frame Timeline panel. CPU Usage is fairly self-explanatory, except to note that it's possible for CPU usage to go above 100% if you have a machine with multiple cores. There's also a Memory breakdown, and the colors in the chart correspond to different types of memory (again, these colors are explained in the Summary panel).
You can select which charts you want to see by toggling the buttons at the top of the Frame Timeline panel. In Figure 11, only the Frame Time, CPU Usage, and Memory charts are shown. If you click Events, you'll see an events track pop up underneath the Memory chart (see Figure 13). Each horizontal track represents a specific type of event, and the intensity of the blue bars gives you an indication of how many events of each type took place on each frame.
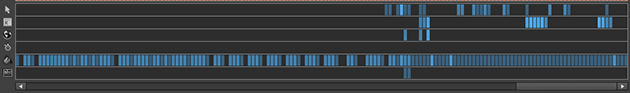
Figure 13. Events in the Frame Timeline panel
The event tracks are as follows:
- Mouse Are there any mouse events dispatched?
- Keyboard Are there any keyboard events dispatched?
- Network Are there any network I/O operations happening?
- Timer Is the Timer class being used?
- Rendering Is there any rendering happening?
- Trace Events Are there any
trace()calls invoked in your ActionScript code?
As you can see, the Frame Timeline panel enables you to quickly find hotspots in your application, identify where too much time is being spent, and find out why.
Summary
The Summary panel describes the color-coding of the charts in the Frame Timeline panel, but it's more than just a legend. You can click and drag in the Frame Timeline to select a range of frames. The Summary panel then summarizes the data for the selected frames, so you can see what was happening in those frames on average.
Figure 14 shows the Summary panel with two frames selected. The first thing to notice is the framerate number in the top-left corner. This was only 1.8 fps, while the target framerate was 24.0 fps, so the framerate was 248% over budget. The content wasn't running smoothly, and you probably want to know why!
Looking at the breakdown of time, you can see that the vast majority was spent executing ActionScript code. This is a hint that you might want to investigate what the code was doing, and try to optimize it. There are other panels in Scout that help you do this, and you'll look at those a little later. Note that if you click on the small gear icon on the right, you can switch between displaying total times over the selection (see Figure 14) and average times per frame.
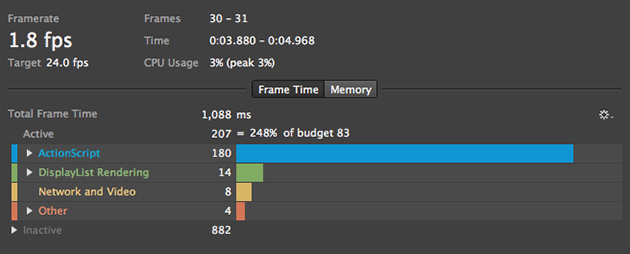
Figure 14. The Summary panel
In this scenario, since the ActionScript code is clearly a problem, you might want to filter out the other categories, so you can focus on just ActionScript execution. There are many different colors in Scout, and this can be distracting, so take a second to filter out the ones you don't want to see.
Click on the ActionScript category, and you'll see that the rest of the categories are grayed out (see Figure 15). More importantly, the Frame Timeline is also filtered, so you can see a chart of just the ActionScript code that was executed in each frame (see Figure 16). In fact, all the colors in Scout get filtered, making it easy to concentrate solely on the data that you're interested in.
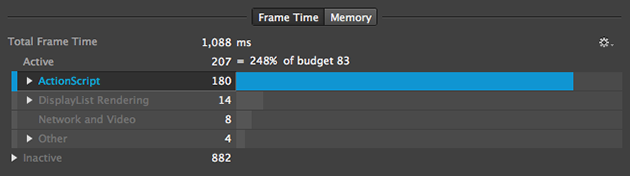
Figure 15. Filtering in the Summary panel
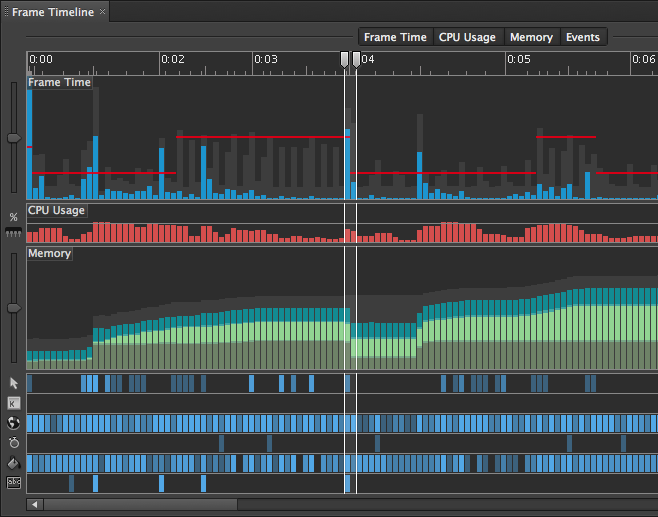
Figure 16. The Frame Timeline, filtered by the Summary panel
In addition to clicking on a category to filter it, some categories can be expanded to show more detailed information. Figure 17 shows how Bitmap Memory can be expanded into a more detailed breakdown. The new colors show up in the Frame Timeline, so you can see how they evolve over time.
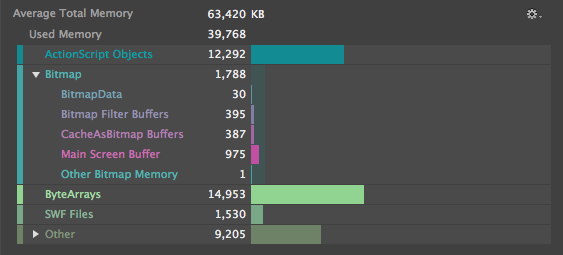
Figure 17. Expanding Bitmap memory in the Summary panel
Top Activities
The Top Activities panel shows much more detail about what's happening inside Flash Player than the Summary panel. Rather than breaking down time into high-level categories, like ActionScript, it shows a detailed breakdown of activities, such as handling specific events (see Figure 18).
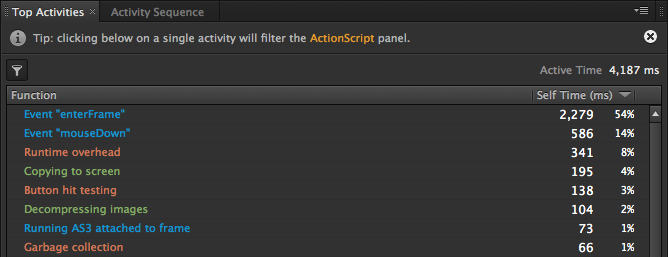
Figure 18. The Top Activities panel
The numbers in the right-hand column reflect how much time was spent on each activity, and what percentage of time Flash Player spent performing that activity. In this example, most of the time (54% or 2,279ms) was spent in event handlers for the enterFrame event, so it would be a good idea to optimize that. You'll come back to that later, when you look at the ActionScript panel.
Activity Sequence
The Top Activities panel shows which activities are taking the most time, but it's often useful to see the precise sequence of each activity. This is the purpose of the Activity Sequence panel. Unlike the Top Activities panel, which aggregates data over multiple frames, the Activity Sequence panel (see Figure 19) shows you information for a only single frame (otherwise, there would be too much data to display).
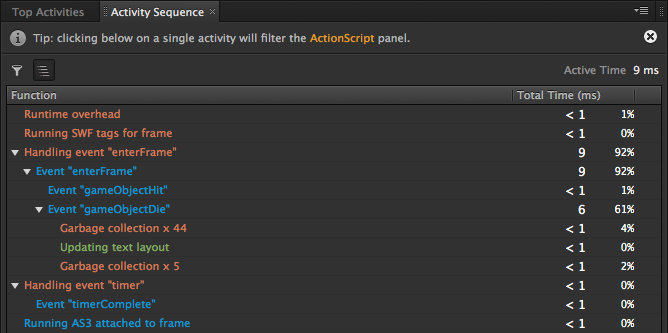
Figure 19. The Activity Sequence panel
The Activity Sequence panel shows the precise order and nesting of the activities in a single frame. For example, in Figure 19, you can see that 92% of the time was spent handling an enterFrame event, and that this in turn caused a gameObjectDie event that took 61% of the time. You can also see that quite a bit of garbage collection happened during the event handler, and the text layout was updated.
By default, activities that take less than 0.5 ms are filtered out from the Activity Sequence and Top Activities panels, so that you can concentrate on the most time-consuming operations. You can disable this by deselecting the filter button in the top-left corner.
Note that the color scheme here is consistent with the Summary panel, so you can easily relate the data in different panels together. Filtering a category in the Summary panel will gray-out all the activities except for the ones that you're interested in, so that you can focus on just the information you're looking for.
ActionScript
So far you've looked at the internal activities of Flash Player, but the thing you're probably most interested in is what your ActionScript 3 code is doing. This is shown in the ActionScript panel (see Figure 20).
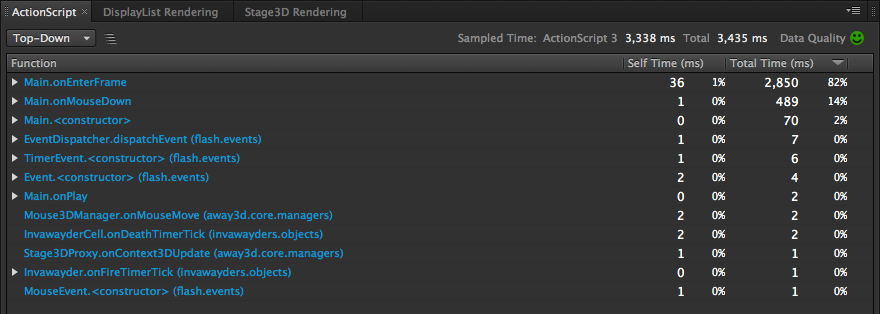
Figure 20. The ActionScript panel
When you first look at the ActionScript panel, you'll see a list of the top-level function calls—the functions that Flash Player calls in your ActionScript code. To expand, and see the full call stack, just click the Expand All button to the right of the Top-Down setting (see Figure 21). You can also Alt-click on one of the triangles to expand it completely.
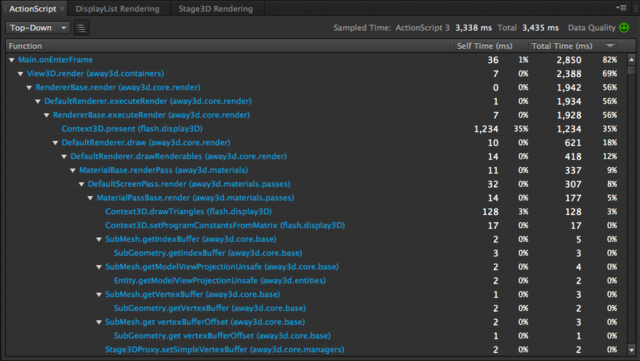
Figure 21. The ActionScript panel with Expand All selected
You can scroll down the call stack to find out which native calls are taking the most time. In Figure 22, you can see that the Context3D.present call is the most expensive, taking 35% of the time.
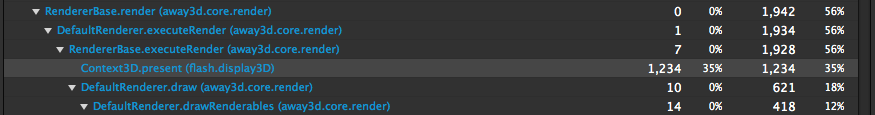
Figure 22. The ActionScript panel showing time spent in Context3D.present
By default, the ActionScript panel displays a Top-Down view of the call stack, where the entry point is at the top, and the native calls are at the bottom of the stack. It is often useful to reverse this view, to see how much time was spent in individual functions. Just select Bottom-Up from at the top of the panel.
You can also get a high-level view of how much time you spend in each package by expanding the ActionScript category in the Summary panel. This has the added benefit of color-coding the functions in the ActionScript panel. Native functions are colored dark blue, custom ActionScript light blue, and Stage3D turquoise green. Figure 23 shows the Bottom-Up view with these colors on.
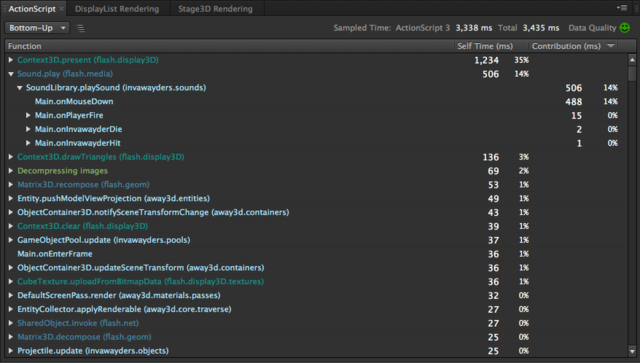
Figure 23. The ActionScript panel with Bottom-Up selected
You can also use the Summary panel to filter out all the functions that aren't in a specific package, making it easier to find and focus on the code you're interested in. Figure 24 shows how this looks when focused on the invawayders package.
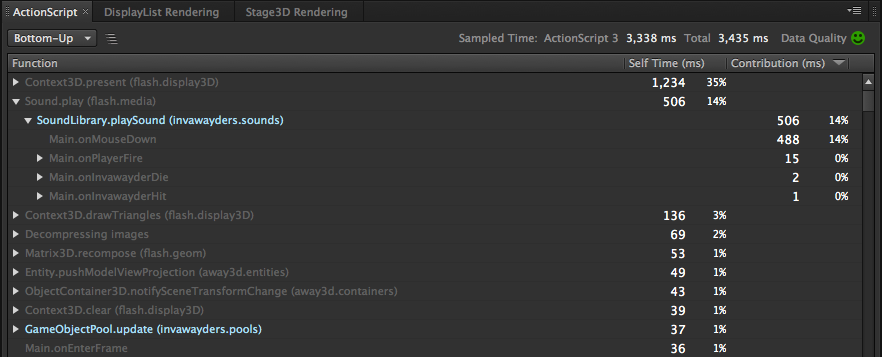
Figure 24. The ActionScript panel filtered on the invawayders package
In the Bottom-Up view, the parent nodes are individual functions, with the Self Time column indicating the overall time spent in that function across the selected frames (not including any calls it might make into other functions). When you expand the parent, you see a reverse call stack, showing what called into the parent function, and what contribution that call had to the Self Time of the parent.
The ActionScript panel shows an aggregated view of the ActionScript code that was executing in the frames selected in the Frame Timeline. It's important to remember that this data is obtained by statistical sampling, which means that the more samples you look at, the more accurate the data gets. If you see a sad face in the top-right corner, that indicates that you need to select more frames!
Another useful feature of the ActionScript panel is that you can interact with the data using the Top Activities and Activity Sequence panels. In both of these panels, you can click on a specific activity to filter the ActionScript panel. As an example, Figure 25 shows the ActionScript panel when you click on the mouseDown event in the Top Activities panel. It shows you only the ActionScript that was executed inside that specific event handler.
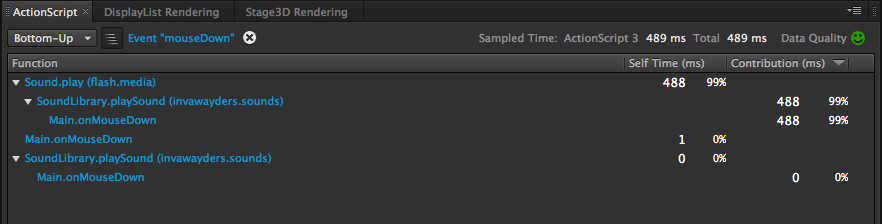
Figure 25. Filtering the ActionScript panel based on the mouseDown event
You can filter on any activity, not just ActionScript event handlers. For example, Figure 26 shows the ActionScript panel filtered by garbage collection. Unlike an event, which calls into ActionScript, the garbage collector can get triggered while your code is in the middle of executing. Filtering by garbage collection lets you see which functions caused garbage collection. You can see it inlined on the call stack. If a particular function causes a lot of garbage collection, it may be doing too many memory allocations.
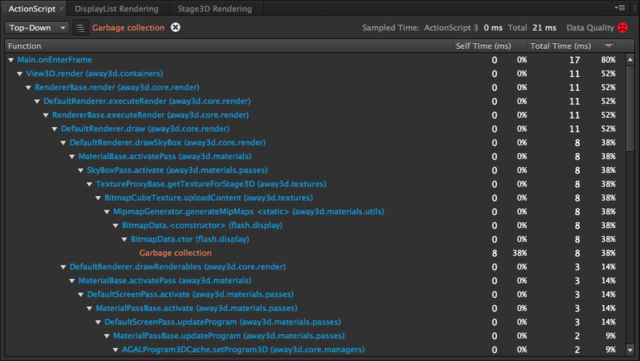
Figure 26. Filtering the ActionScript panel by garbage collection
Trace Log
As well as sampling your ActionScript code, Scout collects the output of any trace() statements in your code. The Event track of the Frame Timeline shows which frames executed trace() statements, and they show up in the Activity Sequence panel if you select a single frame. You can also select any number of frames and see the complete trace() output in the Trace Log panel (see Figure 27).
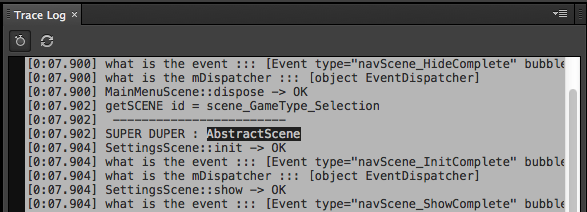
Figure 27. The Trace Log panel
You'll notice two buttons in the toolbar at the top of the panel. The first lets you toggle on and off the display of a timestamp next to each trace() statement.
This is turned on in Figure 27. The second button lets you narrow down the selected frames to include only those where the trace() output that you highlight occurs.
For example, if you clicked on this button in Figure 27, Scout would take you to the frame where the output "SUPER DUPER : AbstractScene" occurred, at time 0:07.902.
Session Info
Scout lets you easily share data with other people. For example, if you discover a performance problem in some Flash content, you can record a Scout session, save it as an FLM file, and send it to a colleague to help with debugging the problem. With all this data, it's easy to lose track of vital information such as which machine you were running Flash Player on, and what version of Flash Player you were using.
The Scout Session Info panel displays this information. It's split into sections, giving you details about the SWF you were running, the Flash runtime, the operating system and hardware of the machine, and the types of telemetry data that you asked Scout to collect (see Figure 28).
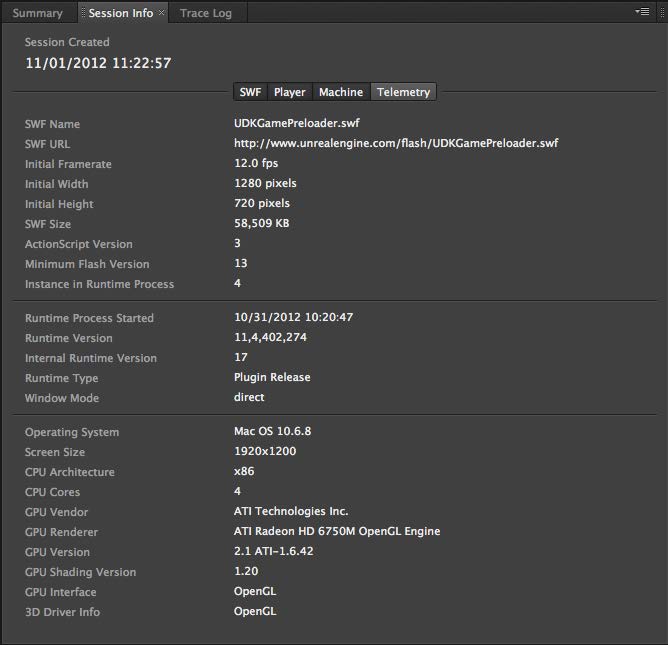
Figure 28. The Session Info panel
DisplayList Rendering
You've now explored many panels that help you diagnose what Flash Player is doing and what your ActionScript code is doing. But what if your problem is related to rendering? One of the highlights of Scout is that it helps you get to the bottom of rendering problems.
If you're using the traditional Flash DisplayList for rendering, you can turn on DisplayList Rendering Details in the settings for new sessions, and collect detailed information about what's going on. When you select a single frame, you can view this data in the DisplayList Rendering panel (see Figure 29).
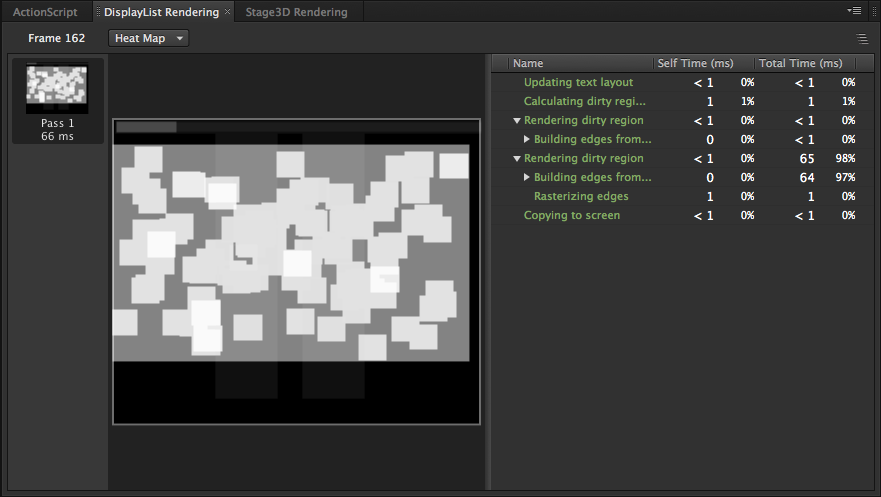
Figure 29. The DisplayList Rendering panel in Heat Map mode
On the left side of the panel is a list of all the rendering passes that occurred in the selected frame, and how long they took. Rendering passes don't always align exactly with frame boundaries,
so you may see a rendering pass that starts on one frame, and finishes on the next.
If you see more than one complete rendering pass per frame, this might be a sign that you're rendering too often.
For example, you may be calling updateAfterEvent() when you don't need to.
The DisplayList Rendering panel opens in Heat Map mode by default. This representation of the screen indicates which areas were rendered. The brightest areas are the ones that took the longest to render, and you can click on an area to highlight it in the tree display on the right. This gives you a detailed breakdown of what was going on during the rendering pass, and how long each step took.
You can get a more detailed view of the rendering pass by switching to the Regions mode (see Figure 30). This breaks down regions on the screen into four different categories that Flash Player uses as part of its rendering engine. Understanding these categories can help you greatly improve your rendering performance; for example, you don't want to cache something that changes on every frame.
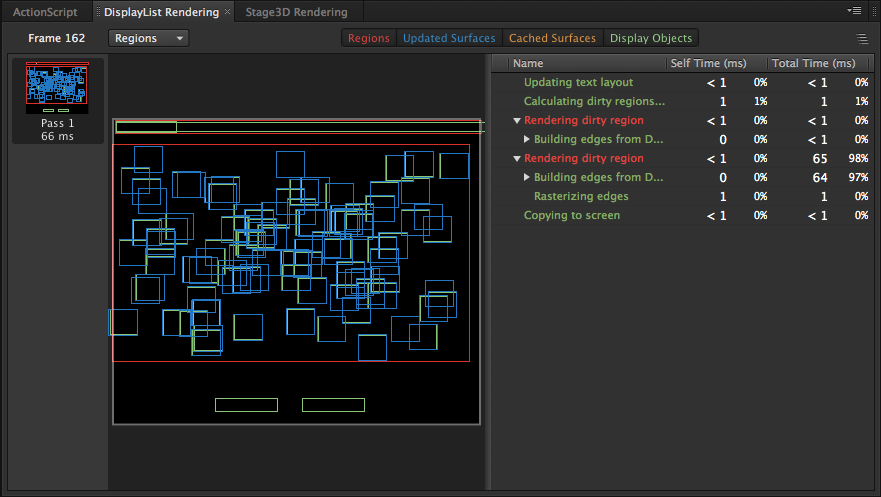
Figure 30. The DisplayList Rendering panel in Regions mode
The four categories (shown at the top of the panel) are color-coded, and can each be toggled on and off:
- Regions (red) are the bounding rectangles containing the pixels on the screen that need to be redrawn. This is the same information that you get from the DisplayList Rendering feature in the debugger version of Flash Player.
- Updated Surfaces (blue) are surfaces that were updated in this rendering pass. Surfaces are bitmaps that Flash Player creates internally when using filters, blend modes, bitmap caching, and bitmaps.
- Cached Surfaces (yellow) are surfaces that are cached by the runtime, so they can be reused over multiple frames. Only the caches that were re-rendered on this rendering pass are shown.
- Display Objects (green) are vector content that you add to the DisplayList. Again, only the display objects that were rendered are shown.
Notice that the activities on the right are also color-coded using the same scheme. You can click on any area of the display to highlight the corresponding activity (see Figure 31). The little dots next to the entries indicate that the region was redrawn, because it needed to be updated.
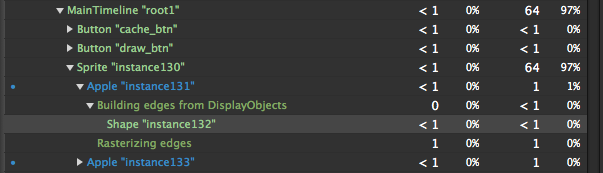
Figure 31. Selecting a graphical object in the DisplayList Rendering panel
Stage3D Rendering
If you're developing GPU-accelerated content for Flash, you'll be making use of the new Stage3D APIs. This is a platform-agnostic way of using the GPU to accelerate rendering on both desktop (Adobe AIR 3.0 and above as well as Flash Player 11 and above) and mobile (Adobe AIR 3.2 and above) applications. You might be developing 3D content, or you could be using a 2D framework such as Starling, which uses the GPU to render 2D content.
If you turn on Stage3D Recording in Scout, Flash Player will send every Stage3D command that your content executes to Scout. In other words, all calls performed on the Context3D object will be recorded. The Stage3D Rendering panel enables you to replay these commands step-by-step (see Figure 32).

Figure 32. The Stage 3D Rendering panel
In this panel, you can see a list of all the Stage3D commands in the frame you selected. You can click on any draw call (Context3D.drawTriangles), and the left side of the panel will update to show you the state of the back buffer immediately after that call. Pressing space will jump to the next draw call (Pressing Backspace jumps to the previous one), making it very easy to step through the rendering of the scene (see Figure 33).
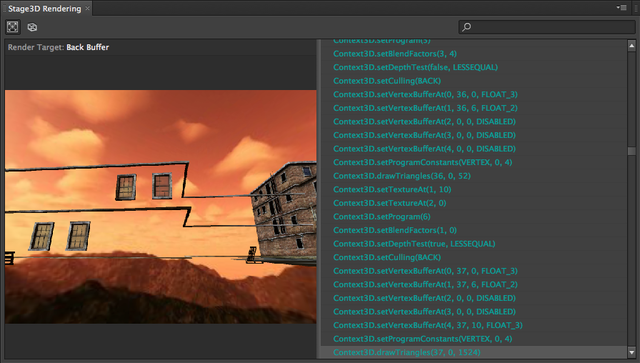
Figure 33. A partially rendered scene created by stepping through draw calls
If you use render-to-texture in your content, then Scout will automatically show you the currently selected render target (i.e. which texture you're rendering to), in place of the back buffer.
Each Stage3D command is shown in a compact format, with the arguments in the order they were passed to the command. If you forget what each argument means, you can right-click on the command list and select Show Argument Names.
The Stage3D Rendering panel can step through draw calls because Scout has a copy of the Stage3D engine running inside it. The runtime is not sending bitmaps to Scout; it is sending each Stage3D command and the arguments you supply, such as textures, programs, and buffers. As a result, you can use Scout to investigate and explore your scene in interesting ways and to debug your content.
Wireframe mode, which can be turned on from the toolbar at the top of the panel (see Figure 34), shows you a preview of the scene with only the edges of triangles rendered, so you can look behind each object and see what was drawn.
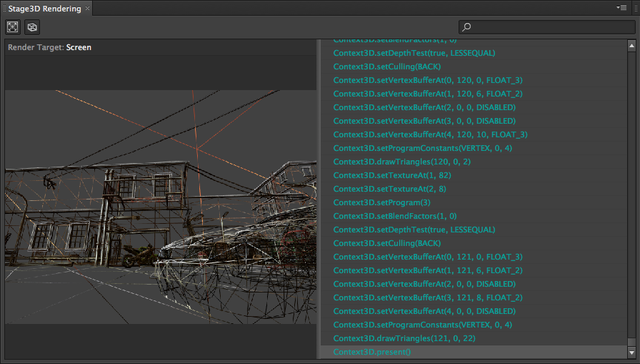
Figure 34. Stage3D wireframe mode
While you need to have Stage3D Recording turned on to use the Stage3D Rendering Panel, useful information about GPU memory is always captured. For any Stage3D content, you can refer to the GPU Memory section in the Summary panel (see Figure 35), and also turn on corresponding charts in the Session Summary and the Frame Timeline.
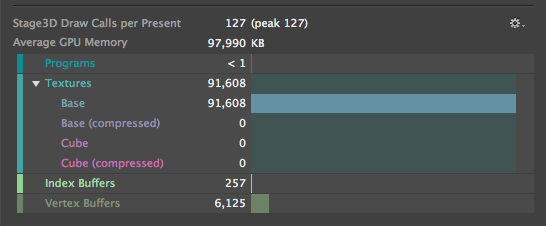
Figure 35. GPU memory usage in the Summary panel
You can see the number of draw calls for each scene and a breakdown of resource memory, which is usually dominated by the textures that you upload.
Stage3D Program Editor
Because Scout has complete information about the Stage3D commands your application executes, you're can interactively modify each command and see what effect this has on rendering. Every time you call Context3D.drawTriangles, you're telling the GPU to run two programs: a vertex program that positions several triangles on the screen, and a fragment program that colors in the individual pixels of each triangle.
Scout lets you interactively view and edit these programs, using the Stage3D Program Editor.
In the Stage3D Rendering panel, click on a draw call (see Figure 36) and then switch to the Stage3D Program Editor (see Figure 37), which you can open from the Window menu. It shows you the AGAL code for the vertex and fragment programs executed by that draw call.
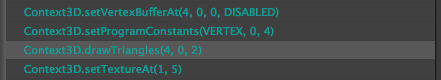
Figure 36. The Stage3D Rendering panel, with a draw call selected
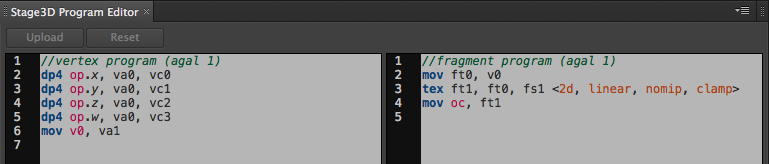
Figure 37. The Stage3D Program Editor
You can interactively edit each of these programs, and then click Upload to tell Scout to re-render the scene with the modified program. Figure 38 shows a scene in the Stage3D Rendering panel, for which the fragment program for the selected draw call is the following:
//fragment program (agal 1)
tex ft0, v0, fs1 <2d, linear, miplinear, repeat>
tex ft1, v1, fs2 <2d, linear, miplinear, repeat>
mul oc, ft0, ft1
The first two lines of this program sample from two different textures, and the last line multiplies the textures together to determine the output color for the pixel. The first texture (fs1) is for the pattern of the bricks on the walls of the building, and the second (fs2) is for the shadows.
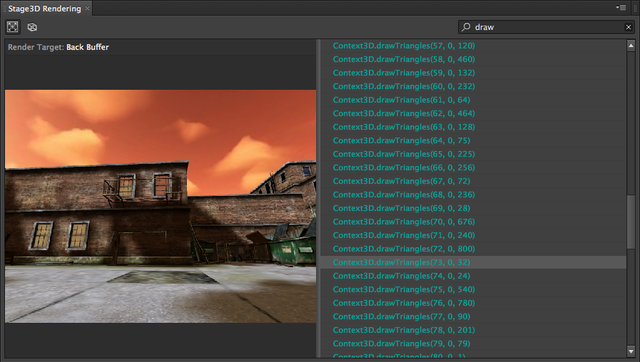
Figure 38. Original scene, with no program modification
To see how program modification works, change the last line, so that instead of multiplying the two textures together, it sets the color based on the first texture:
//fragment program (agal 1)
tex ft0, v0, fs1 <2d, linear, miplinear, repeat>
tex ft1, v1, fs2 <2d, linear, miplinear, repeat>
mov oc, ft0
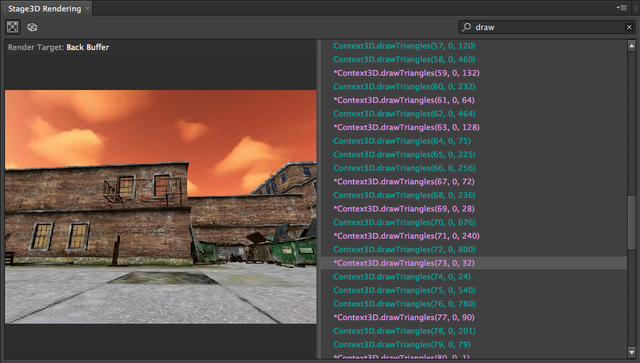
Figure 39. Scene without shadows
When you click Upload, you can see the scene rendered with the new program (see Figure 39). You'll notice that some of the draw calls turned purple, indicating that you've modified the program they use. You can click Reset in the Stage3D Program Editor to revert to the original program.
Next, you can update the program to show just the second texture (the shadows):
//fragment program (agal 1)
tex ft0, v0, fs1 <2d, linear, miplinear, repeat>
tex ft1, v1, fs2 <2d, linear, miplinear, repeat>
mov oc, ft1
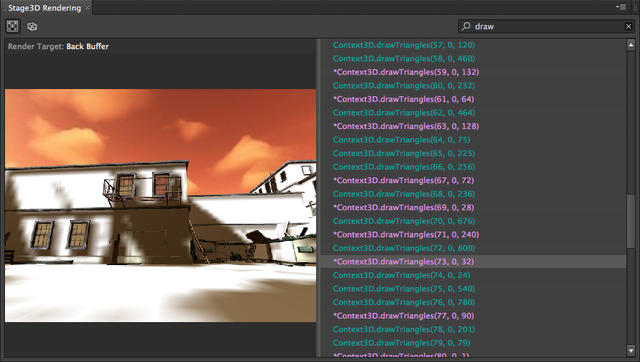
Figure 40. The scene with shadows only
After clicking Upload again, you can see that only the shadows are rendered (see Figure 40).
This interactive capability is great for debugging, and you can also use it while you're learning how to write AGAL programs.
Searching in Scout
Scout version 1.1 provides two new features that make it easier to navigate around a session. There's a new Search menu, and the first item in it is Go to Frame, shown in Figure 41. This lets you quickly jump to a specific frame in the session.
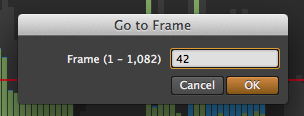
Figure 41. Go to Frame
The second, and most useful feature, is Find. This opens up the Find bar at the bottom of the screen, where you can type in text that you want to search for in the current session (see Figure 42).
![]()
Figure 42. Searching in Scout
As you type, Scout searches all the open panels for the text you enter. It greys out everything that doesn't contain this text, so you can focus easily on what you're looking for. It also tells you how many matches it found, in the open panels. Figure 43 shows a search across the ActionScript and Top Activities panels, for anything containing the word "context". Scout will search ActionScript function names, as well as activities, trace statements, names of display objects, and Stage3D commands, depending on which panels are open.
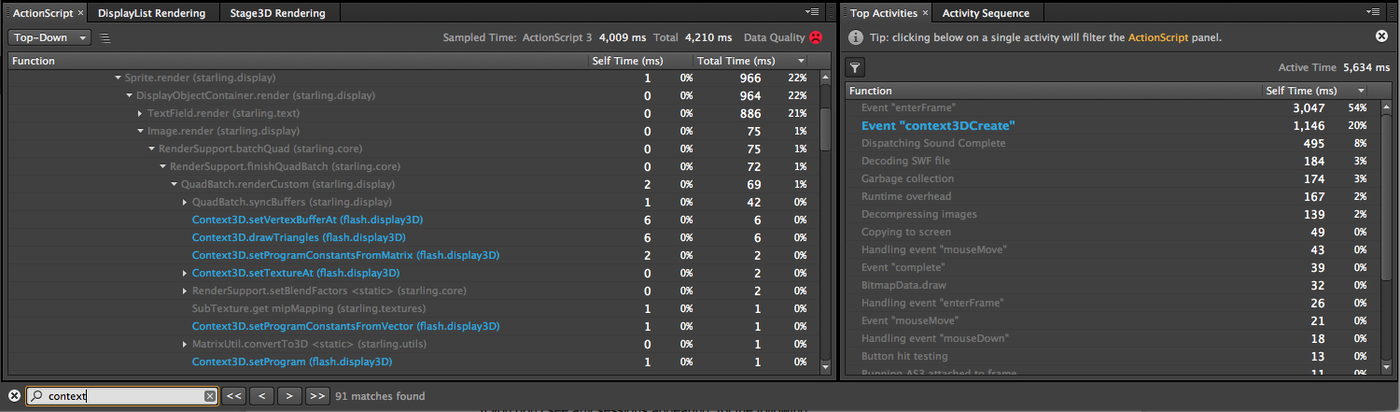
Figure 43. Searching for text in visible panels
If you click on the > or < buttons, Scout will move forwards or backwards between each of the search results.
The current result is shown in a bigger font, to help it stand out. As you skip through the results, Scout will open any rows in the tree, and scroll to make the result visible.
This is really useful for finding a specific function call in a big application.
Perhaps the most useful feature of all is the ability to find text in a different frame.
If you click on the >> button, Scout will search past the end of the current frame selection, until it finds a frame that has the text that you're looking for.
Scout then jumps to that frame, and if the search result isn't in a visible panel, it'll open the panel and scroll to the result. The << button does the same thing, but searches backwards.